Benchmarking Zasper v/s JupyterLab (Jupyter Server)
The primary goal of this benchmarking exercise is to compare the performance of Zasper against the traditional Jupyter Server. Through this comparison, we aim to determine how Zasper performs in a real-world scenario where multiple execute requests are made, with particular interest in resource consumption and efficiency. The focus areas for evaluation are:
- CPU Usage
- RAM Usage
- Throughput
- Latency
- Resilience
Zasper is an IDE designed from the ground up to support massive concurrency. It provides a minimal memory footprint, exceptional speed, and the ability to handle numerous concurrent connections.
It implements Jupyter’s wire protocol and can efficiently run Jupyter Notebooks.
Project Github Link | Benchmark Code Github Link
Key Findings at a Glance
- Performance Gap: Zasper consistently outperforms Jupyter Server across all tested metrics
- Resource Efficiency:
- CPU: Zasper uses up to 5X less CPU resources
- RAM: Zasper uses up to 40X less memory
- Scalability: Zasper maintained performance with 64 kernels at 10 RPS per kernel, while Jupyter Server began failing at this load
- Resilience: Zasper only failed under extremely high loads (64 kernels at 100 RPS per kernel)
- Recovery: Zasper recovers more gracefully from overload conditions
Note: Jupyter Server powers Jupyterlab. Hence, I use the terms interchangeably.
Understanding Jupyter Server Architecture
To establish a baseline, it is important to understand how a Jupyter Server operates internally. Here’s a simplified breakdown:
1. Session Lifecycle
A new session is initiated when a user opens a Jupyter notebook.
This session launches a kernel, which handles code execution.
2. Kernel Channels
The Jupyter kernel communicates with the server over five dedicated channels:
- stdin – for user inputs.
- shell – for sending execution requests.
- control – for kernel control messages.
- iopub – for publishing results back to the client.
- heartbeat – for kernel liveliness checks.
📌 For this benchmarking exercise, we focus only on:
- Shell channel – used to send execution requests (e.g.,
2+2,print("Hello World!")) - IOPub channel – used to receive outputs from the kernel (e.g.,
4,Hello World!)
3. Communication via WebSocket
A WebSocket is established between the user’s browser and the server, allowing real-time, bi-directional communication. The client send the messages over the websocket. When the jupyter_server receives this message it puts this message on a shell channel over ZeroMQ. This message when received by the kernel triggers a computation in the kernel. The kernel emits the output on iopub channel over ZeroMQ. This message is received by Jupyter server and the output is put on websocket.

Methodology
The benchmarking setup follows a controlled and repeatable process:
1. Session Initialization
A session is created and a WebSocket connection is established using a goroutine.
2. Execution Requests
A stream of execute_request kernel messages is sent over the websocket.
3. Monitoring & Logging
System metrics such as CPU usage, memory consumption, and execution throughput are recorded at 10-second intervals. These are visualized for comparison.
Steps to run
- Setting up the benchmark code
git clone https://github.com/zasper-io/zasper-benchmark cd zasper-benchmark # Install go dependencies go mod tidy # Install Python dependencies pip install -r requirements.txt - Setting environment variables
DELAY=10
TOKEN=0f246b68d418b3eeeaee4f2432b42927aa2458a278523114
XSRF_TOKEN=2|42679dac|baa53312a6f622e92be800d4bf32b02c|1743152726
NUM_KERNELS=64
TARGET=jupyter
PID=17656
DELAY is the time duration between two subsequent message requests to a kernel.
NUM_KERNELS : Number of kernel connections you want to create.
TARGET: Define whether you are measuring the performance of jupyter or zasper.
PID: the process id of jupyterlab or zasper once you start the process.
TOKEN: the api_token of jupyterlab session.
XSRF_TOKEN: collect it via the browser. In Jupyterlab ui Open developer tools > Application . Copy the xsrf_token.
- Collecting data for zasper
-
Start Zasper
-
Start the monitoring code
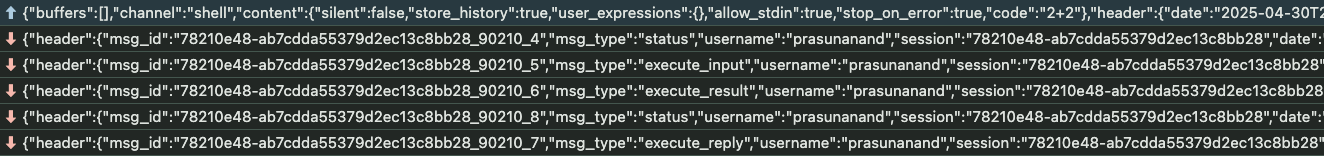
go run .Run with
--debugflag to see therequestsandresponseshappening in real time.
go run . --debug
prasunanand@Prasuns-Mac-mini zasper-benchmark % go run .
prasunanand@Prasuns-Mac-mini zasper-benchmark % go run .
====================================================================
*******            Measuring performance                     *******
====================================================================
Target: zasper
PID: 70049
Number of kernels: 2
Output file: data/benchmark_results_zasper_2kernels.json
====================================================================
Creating kernel sessions ⏳
Sessions created:  ✅
Start sending requests: ⏳
Kernel messages sent:  ✅
====================================================================
*******                   Summary                            *******
====================================================================
Messages sent: 38
Messages received: 192
====================================================================
The program writes the output to data/benchmark_results_zasper_2kernels.json file.
- Collecting data for Jupyterlab
- Start JupyterLab.
- You need to get
api_tokenandxsrf_tokenand paste it in the.envfile. - Start the monitoring code
go run .The program writes the output to
benchmark_results_jupyterlab.json
- Visualize the data
python3 visualize.py --delay=10 --n=64
python3 visualize_resources_summary.py --delay=10
System Specifications
- OS : macOS
- CPU : Apple M4, 10-core CPU
- RAM: 16GB
Note: A typical IPython kernel consumes around 80 MB of RAM on average.

(RAM usage on M4 Mac mini)
On my M4 Mac mini, I can see that leftover RAM is around 9 GB , hence the number of kernels that can fit on my machine is 9GB/80MB = 112 ~= 100 Jupyter kernels.
On an M3 Macbook Air which has just 8GB RAM, the leftover RAM tends to be around 1GB RAM , so we can fit ~10 Ipython kernels running on that machine.
Hence, if you want to run the benchmarks make sure that you have enough RAM for the kernels, else you might end up with results that won’t make sense.
What is RPS per Kernel?
RPS per kernel stands for Requests Per Second per kernel. It refers to the number of execution requests sent to a single kernel every second. This metric is used to measure the load or stress applied to the system during benchmarking.
Message Sent Throughput = num_of_kernels * RPS per kernel
For every execute_request sent to the kernel, the kernel replies with 5 messages.
Message Received Throughput = 5 * Message Sent Throughput
For example:
- If the RPS per kernel is 10, it means each kernel is receiving 10 execution requests per second.
- If there are 64 kernels and the RPS per kernel is 10, the total number of requests being sent across all kernels is 64 × 10 = 640 requests(or messages) per second.
- Message sent throughput = 640 messages per second
- Message received throughput = 640*5 = 3200 messages per second
Relationship Between Delay and RPS
The delay between two execution requests determines the RPS. The formula is:
RPS = 1000 / delay (in milliseconds)
For example:
- If the delay between two execution requests is 10ms, the RPS would be:
RPS = 1000 / 10 = 100This means each kernel would receive 100 requests per second.
This relationship is crucial for understanding how the system behaves under different loads and how delay impacts the throughput.
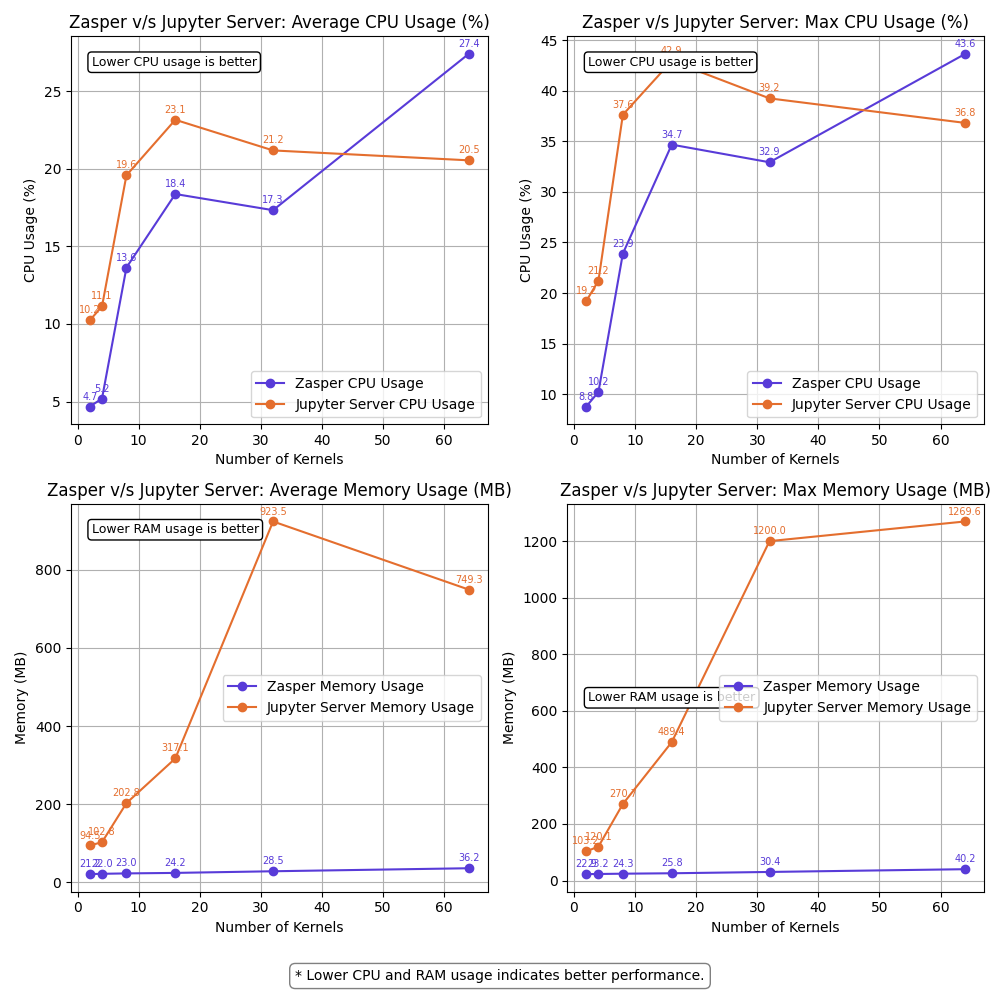
Results
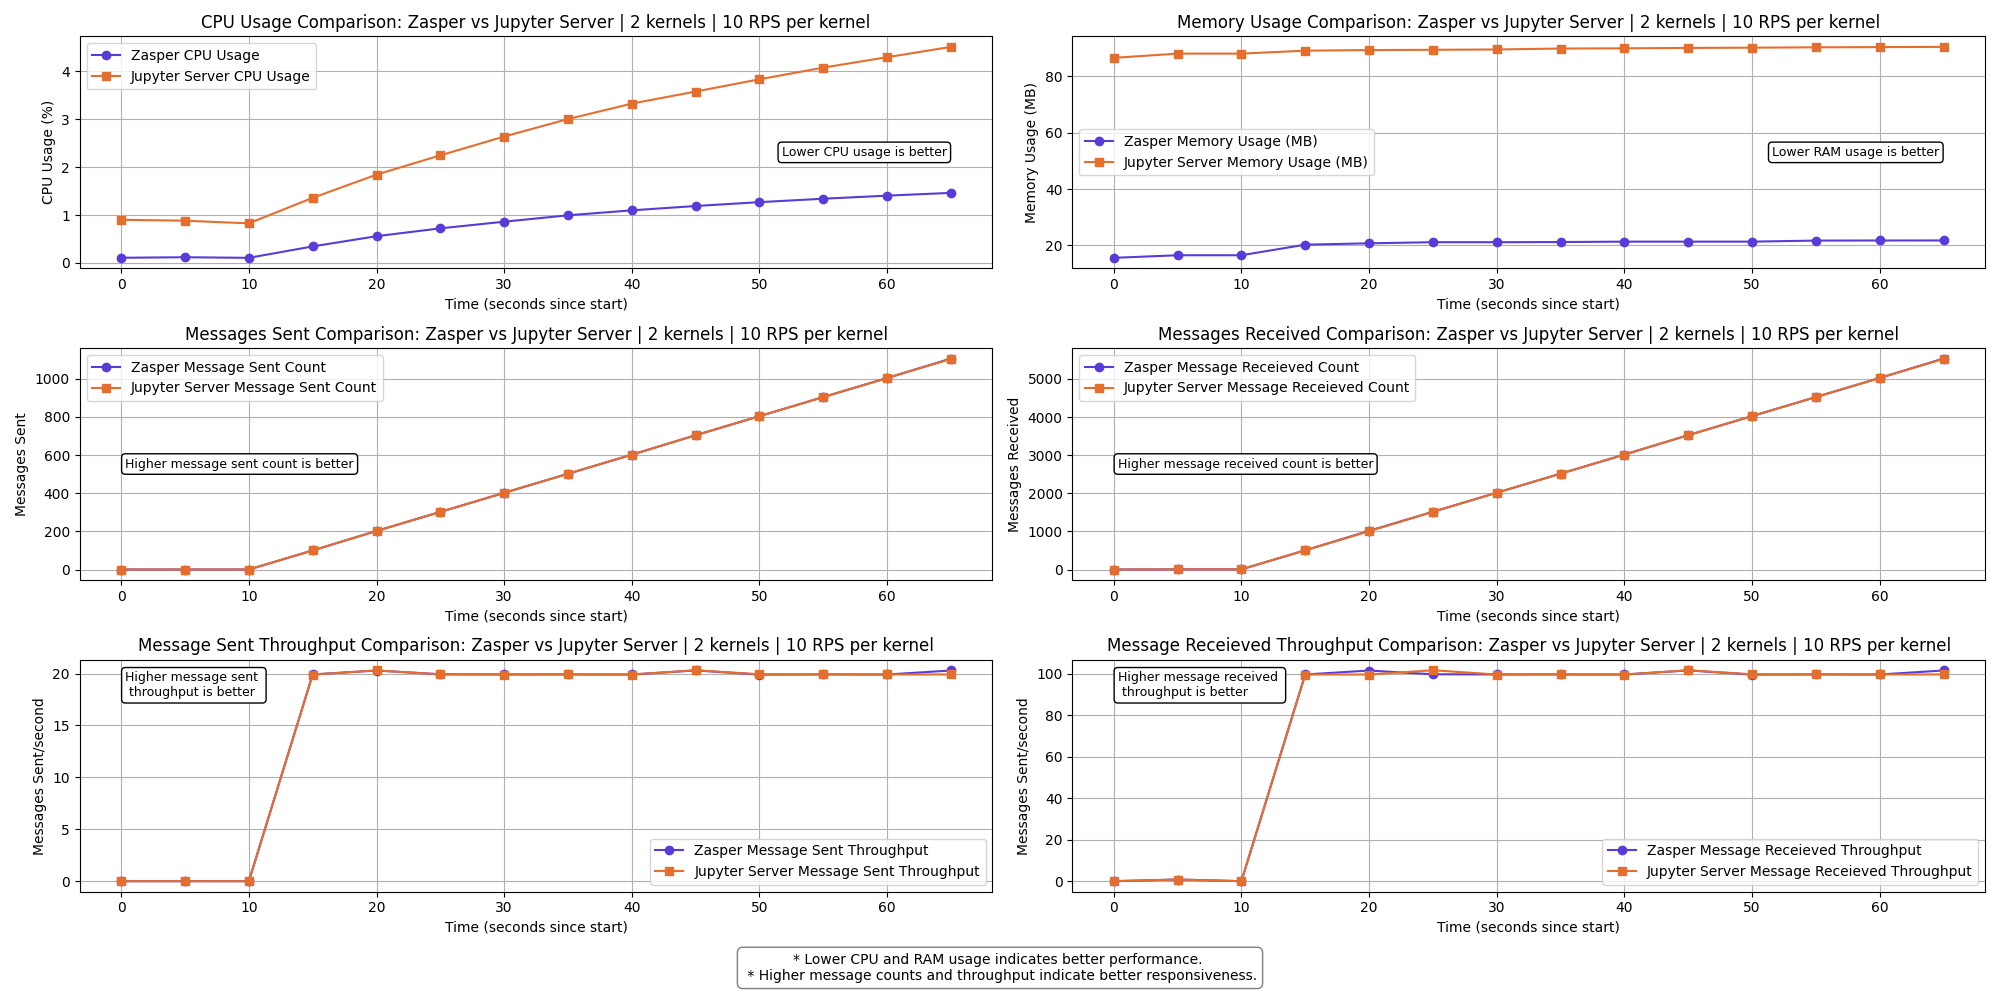
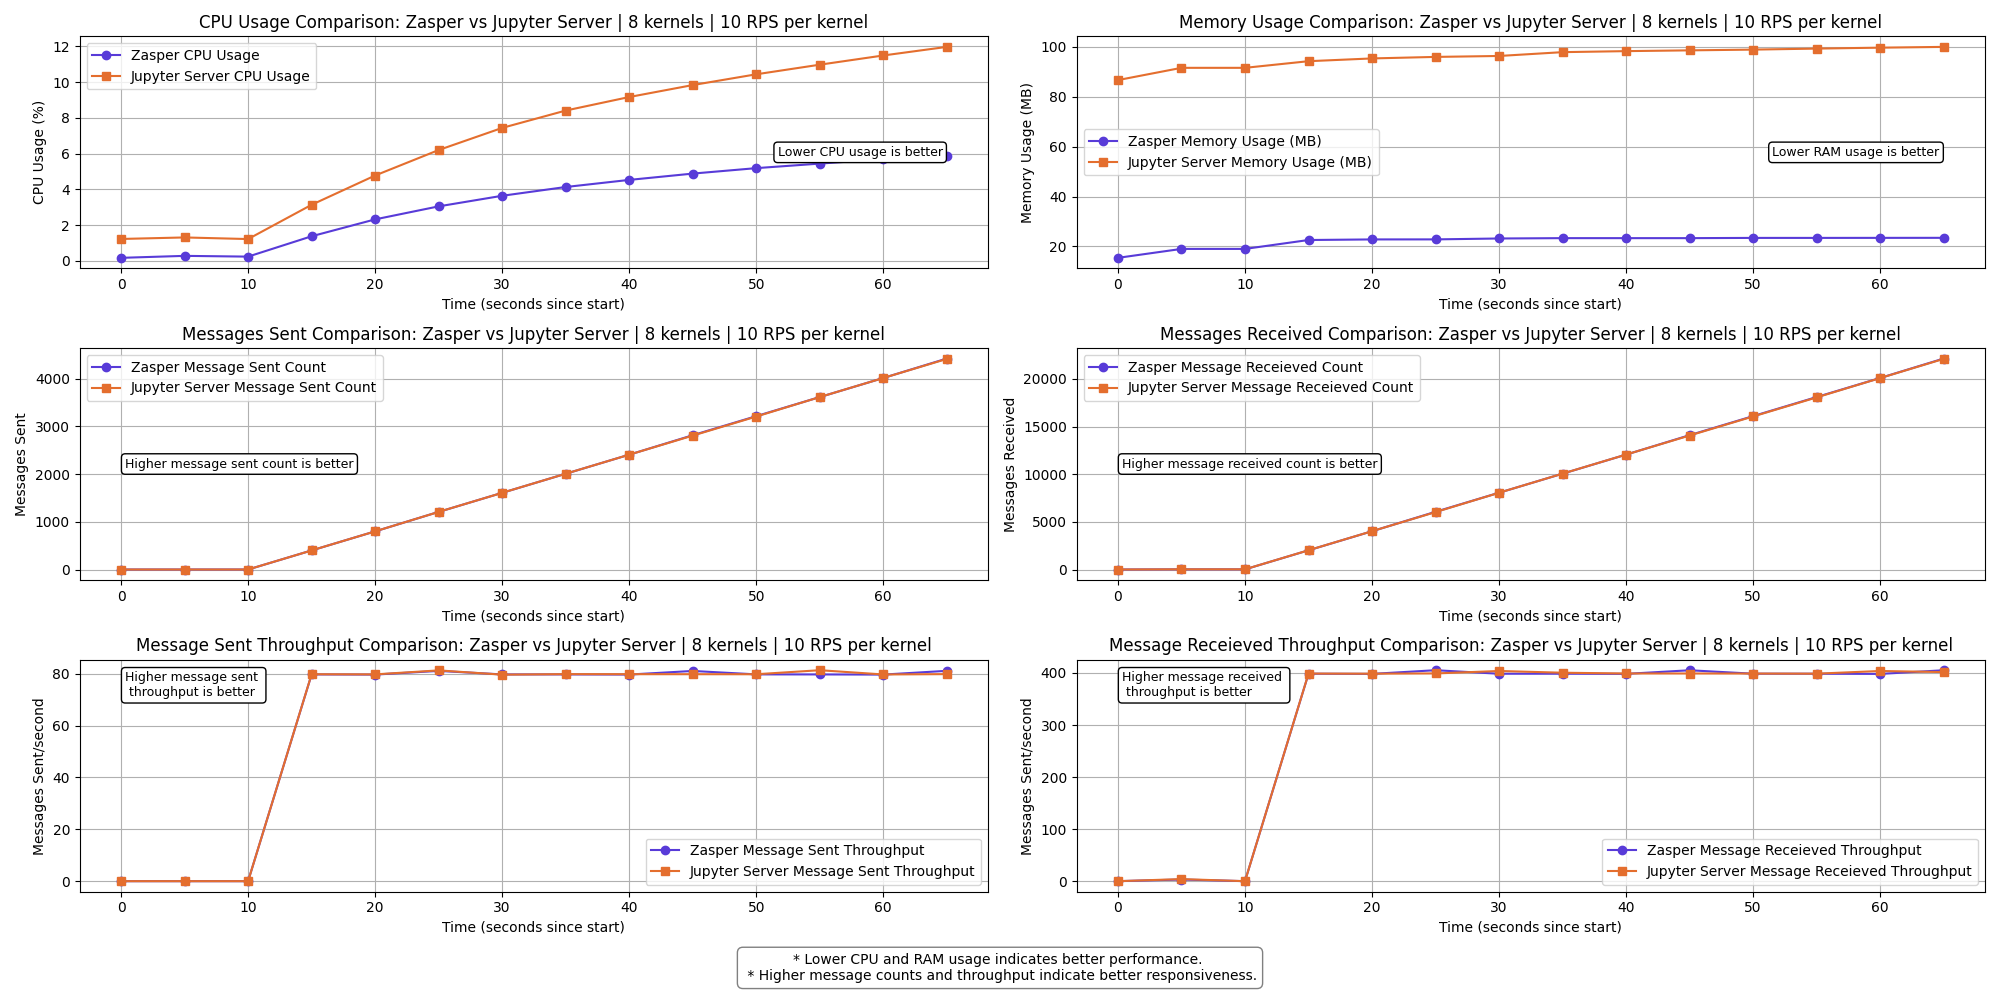
The graph shows a clear performance difference between Zasper and Jupyter Server across the selected metrics.
- Lower CPU usage and RAM usage is better.
- Higher Message sent and Message received is better
- Higher Message sent per second (throughput) and Message received per second (throughput) is better.
2 kernels | 10 RPS per kernel
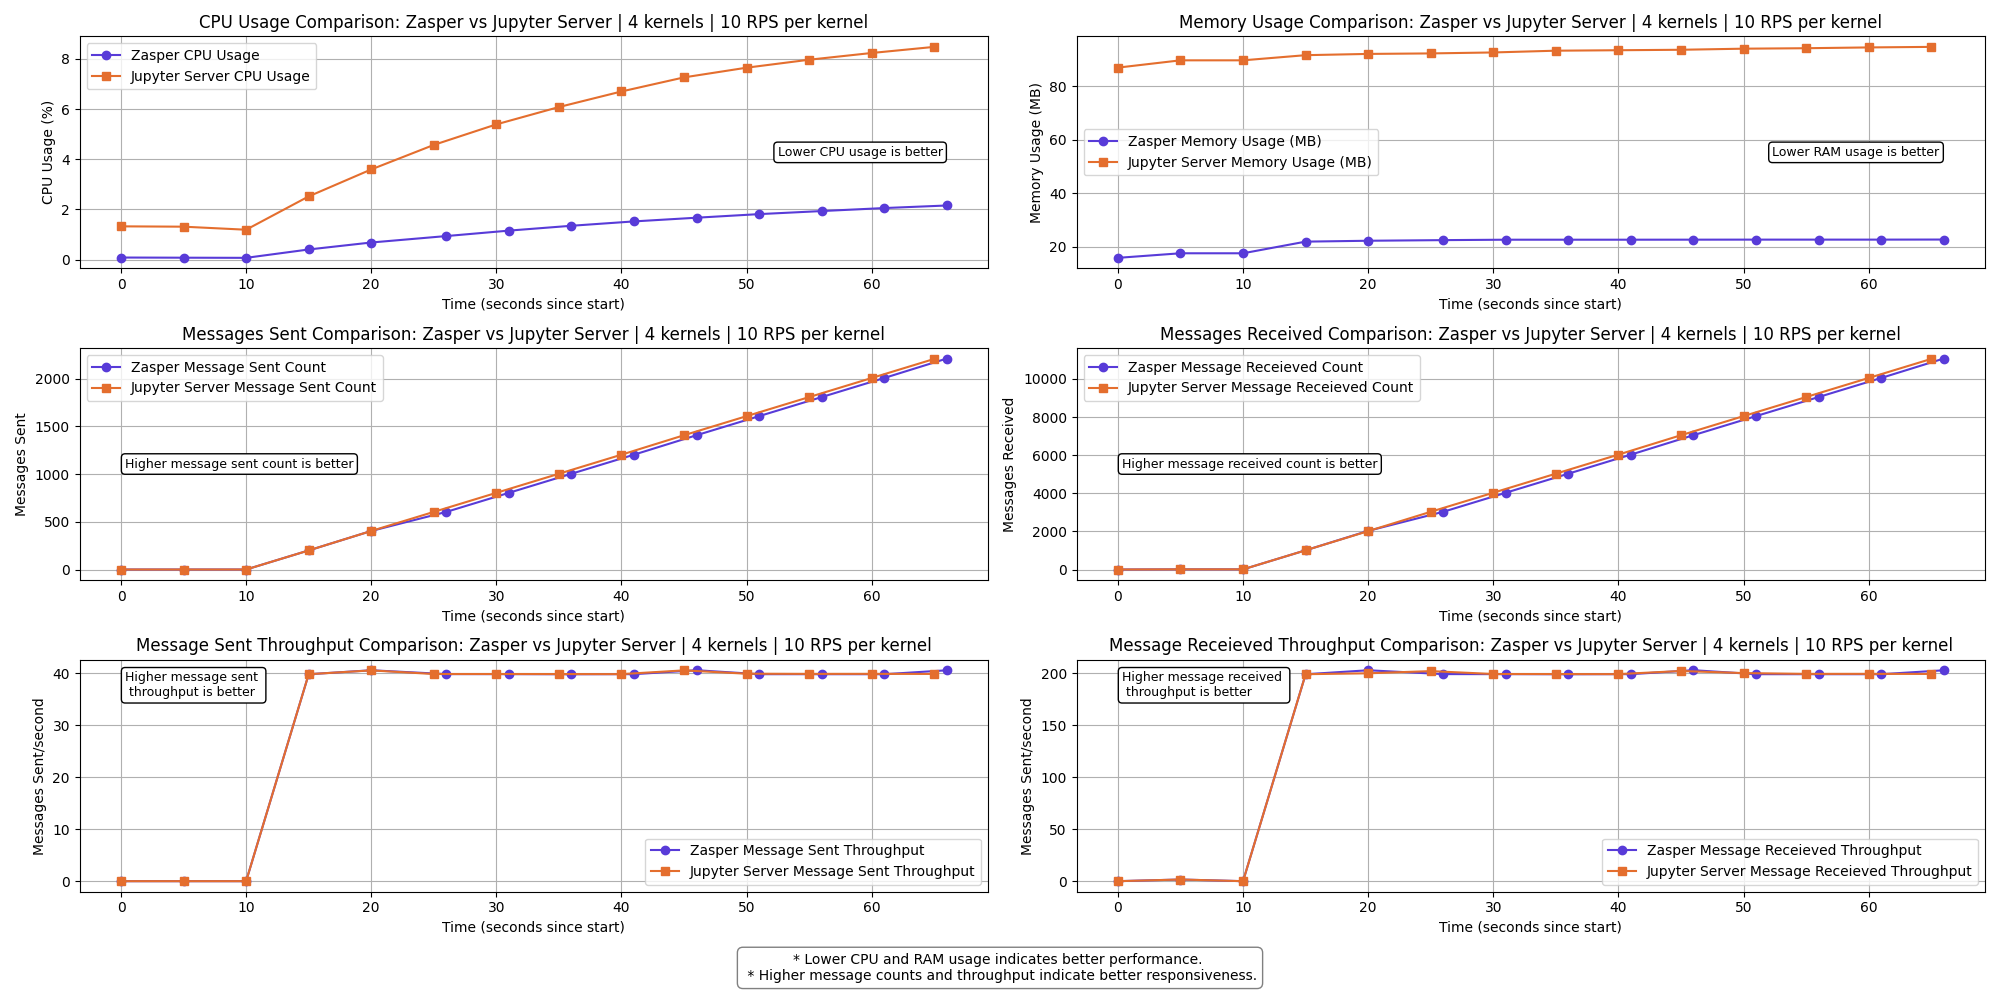
4 kernels | 10 RPS per kernel
8 kernels | 10 RPS per kernel
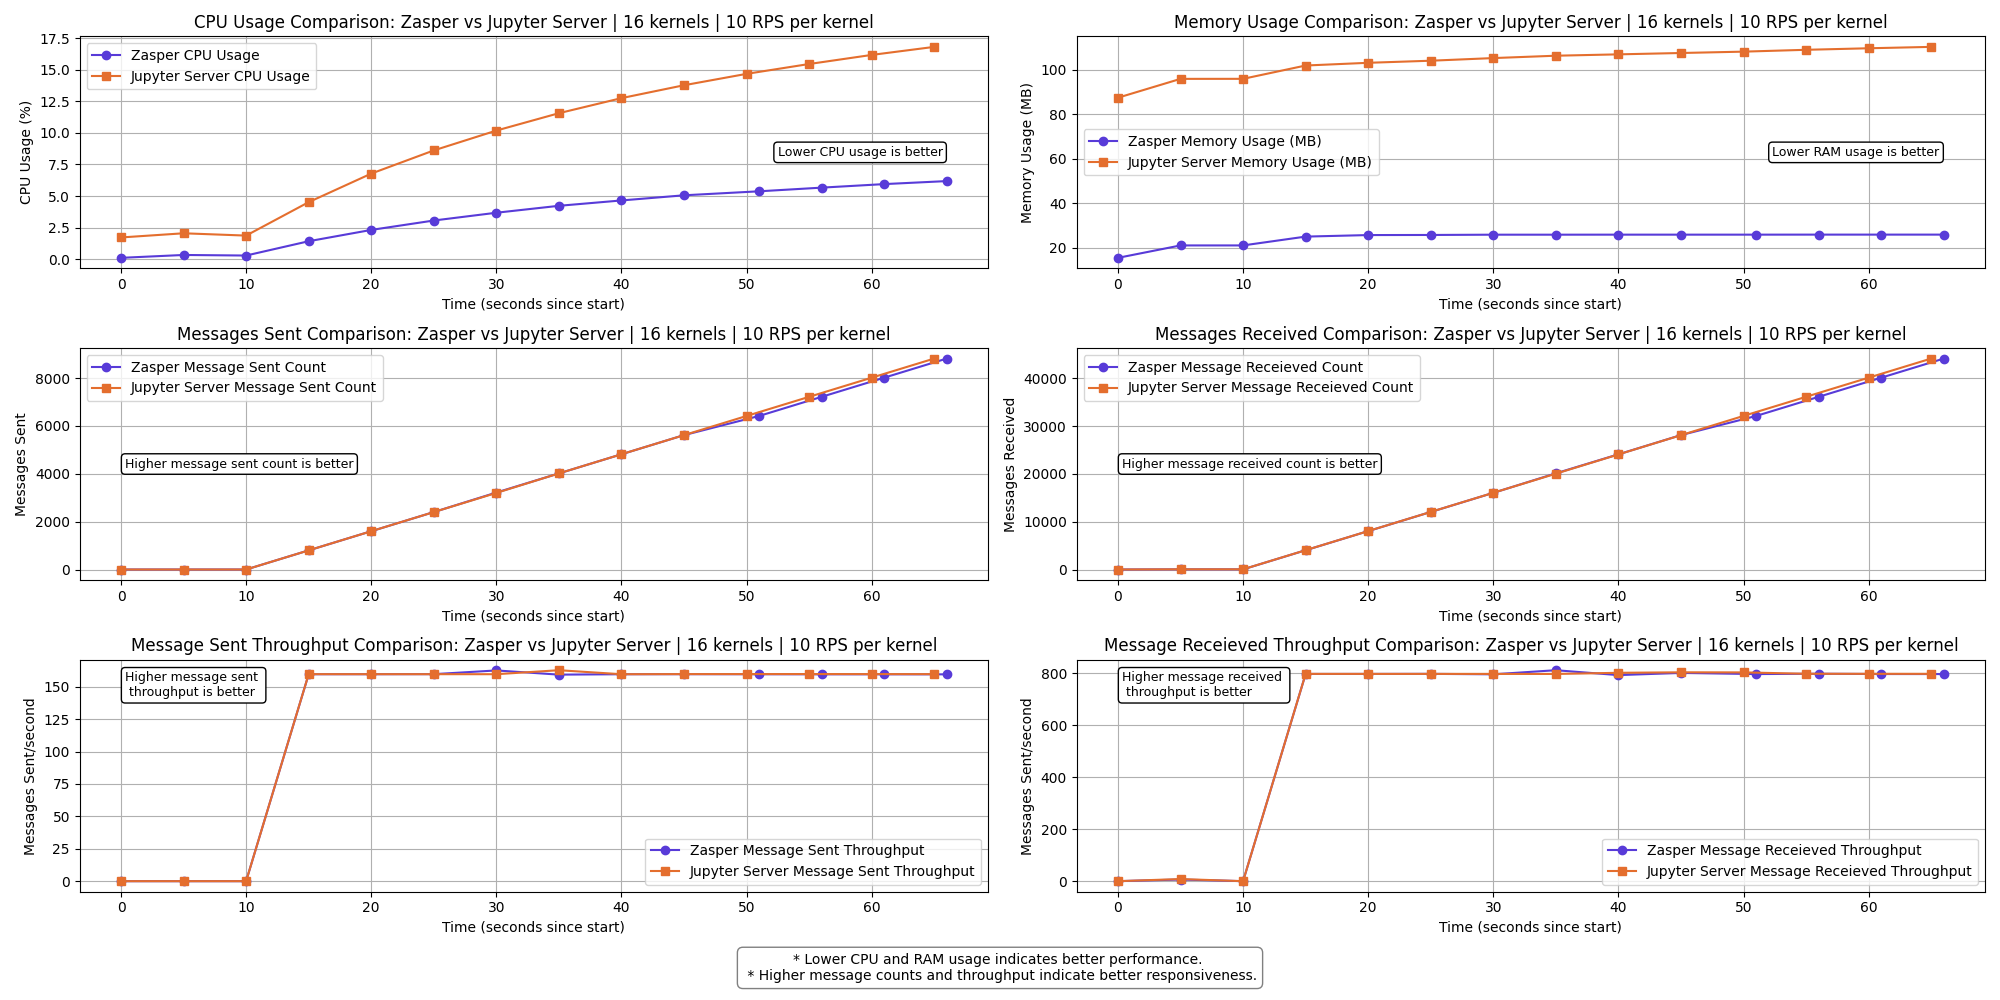
16 kernels | 10 RPS per kernel
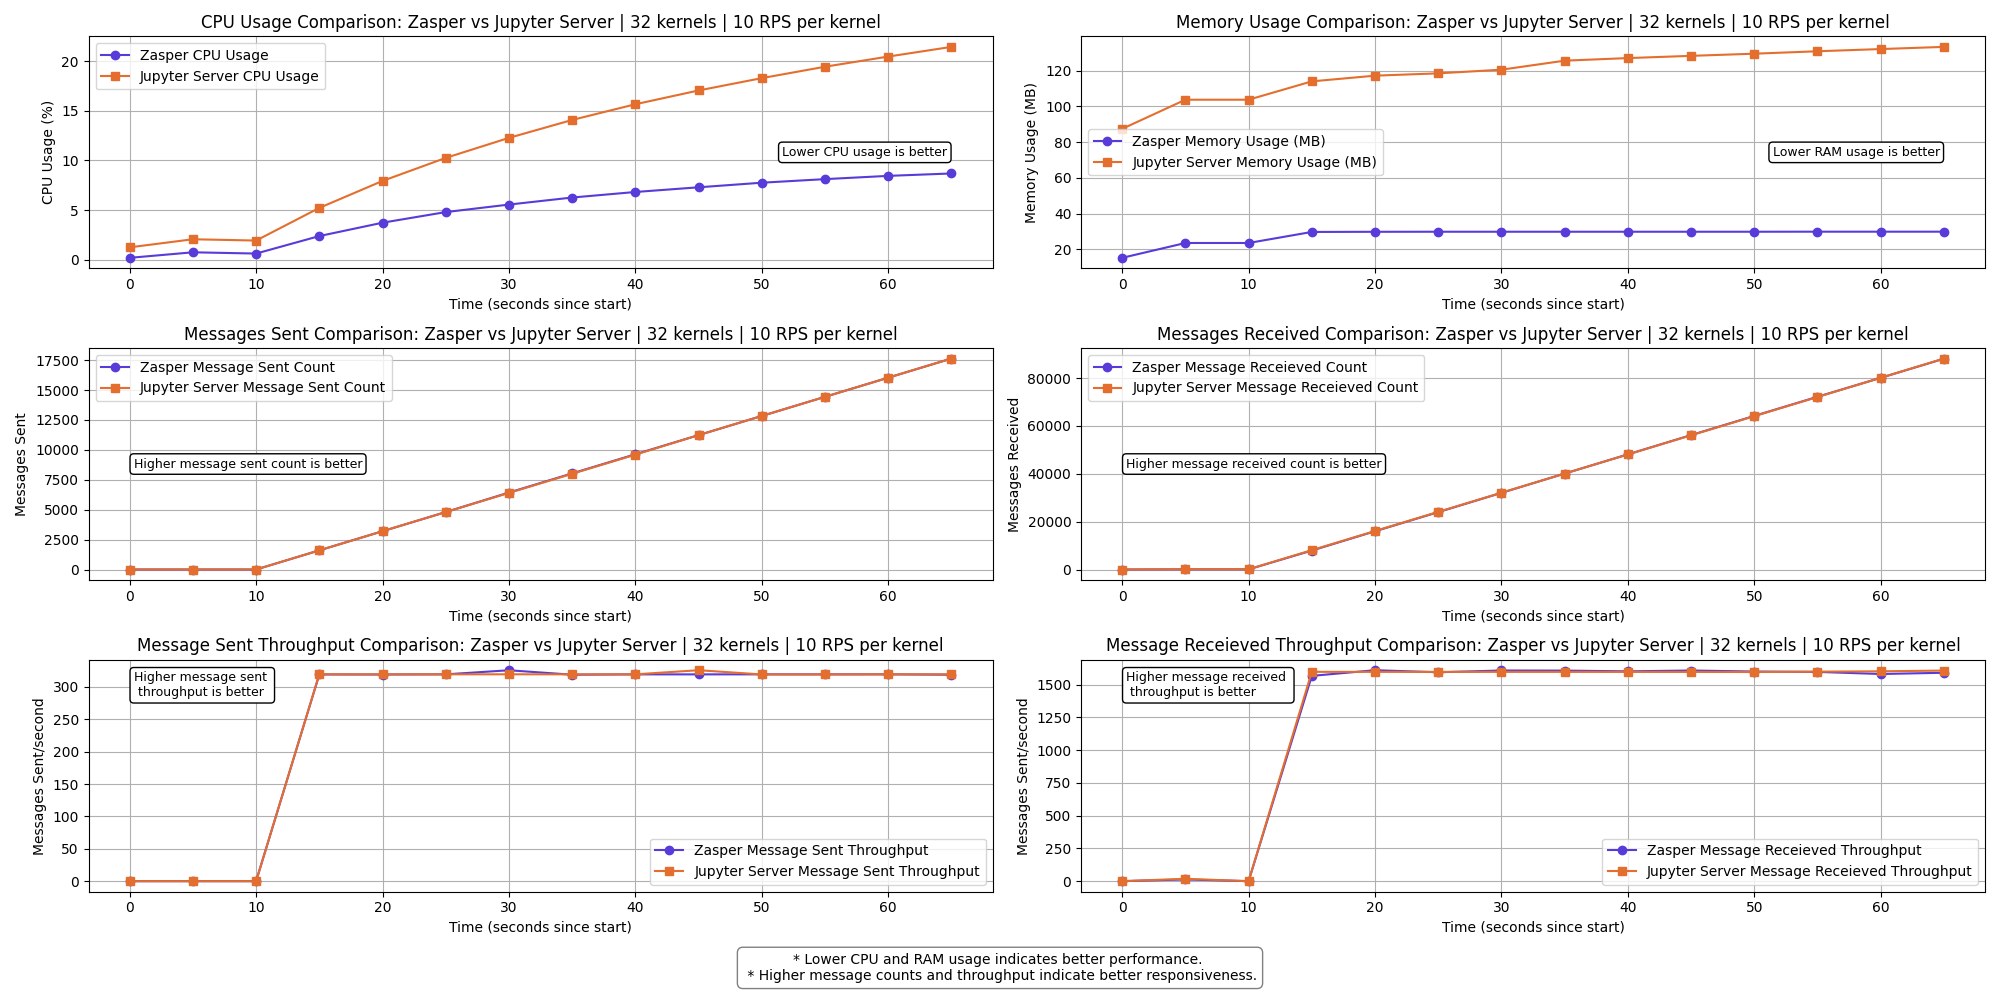
32 kernels | 10 RPS per kernel
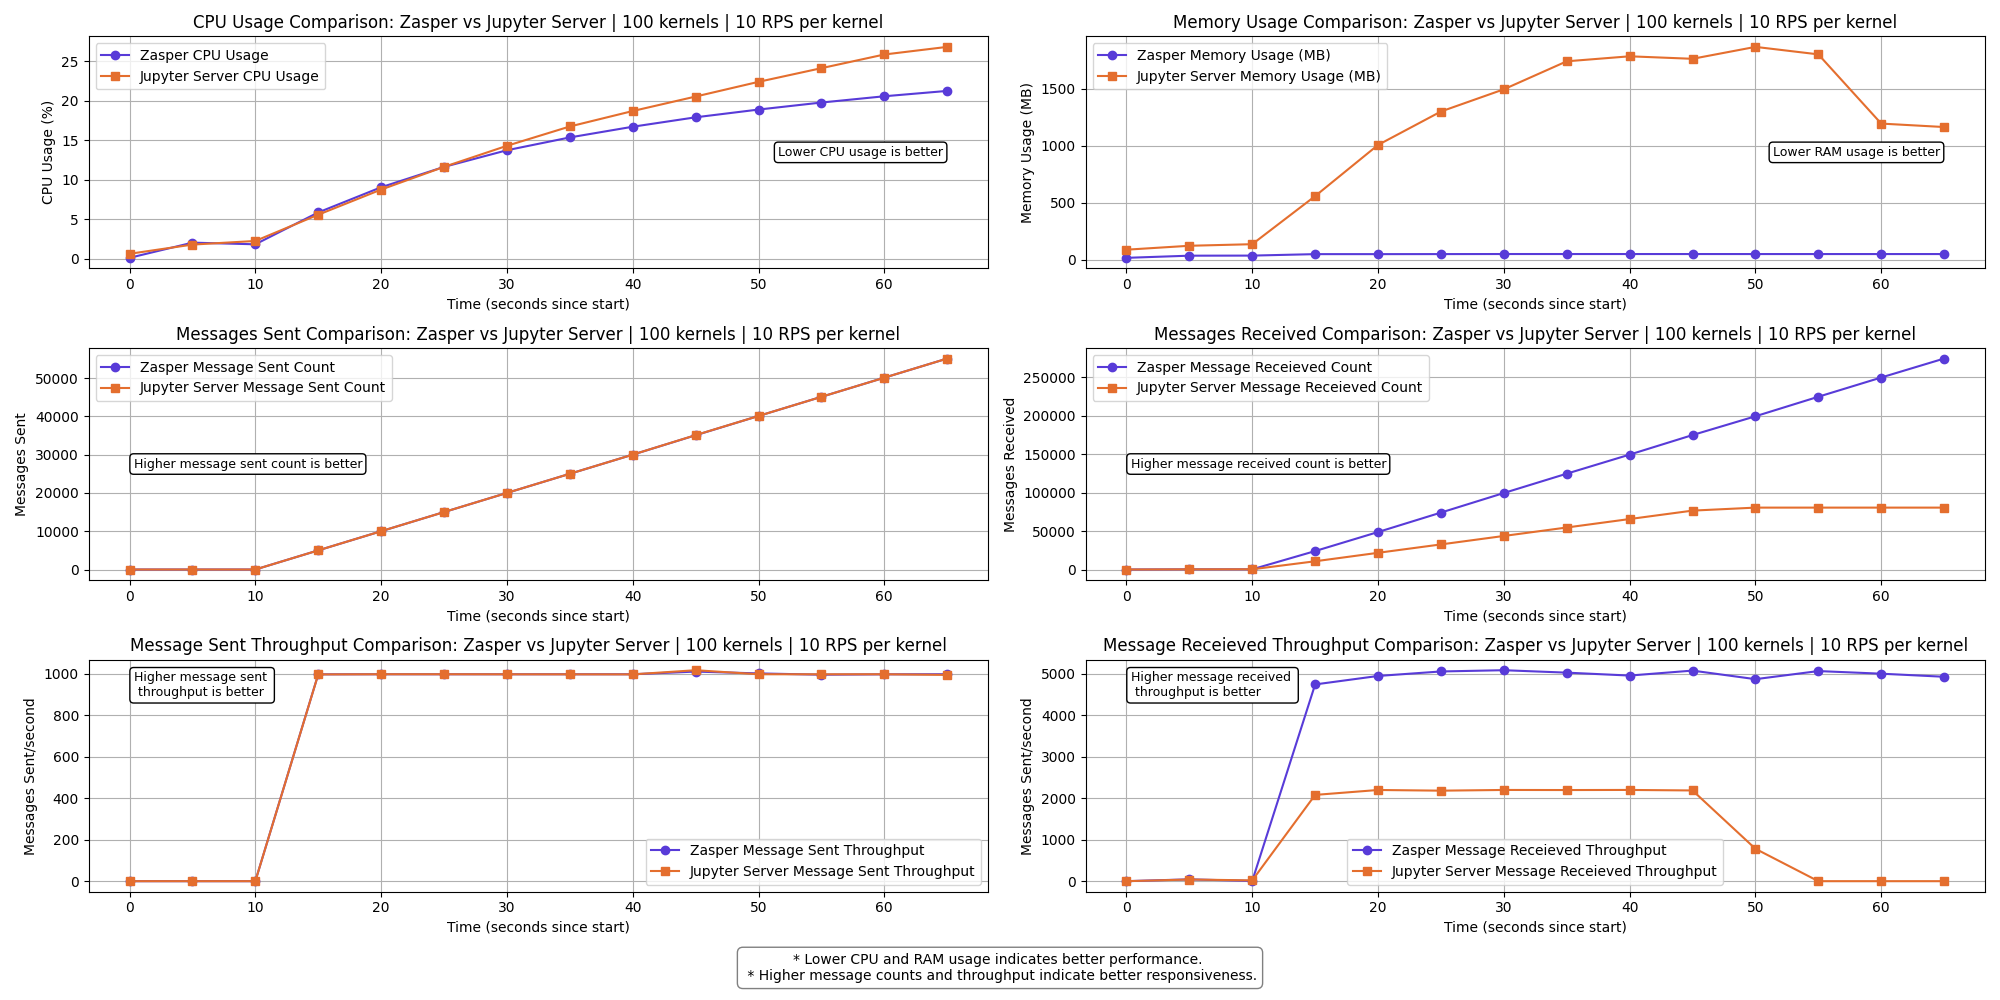
64 kernels | 10 RPS per kernel
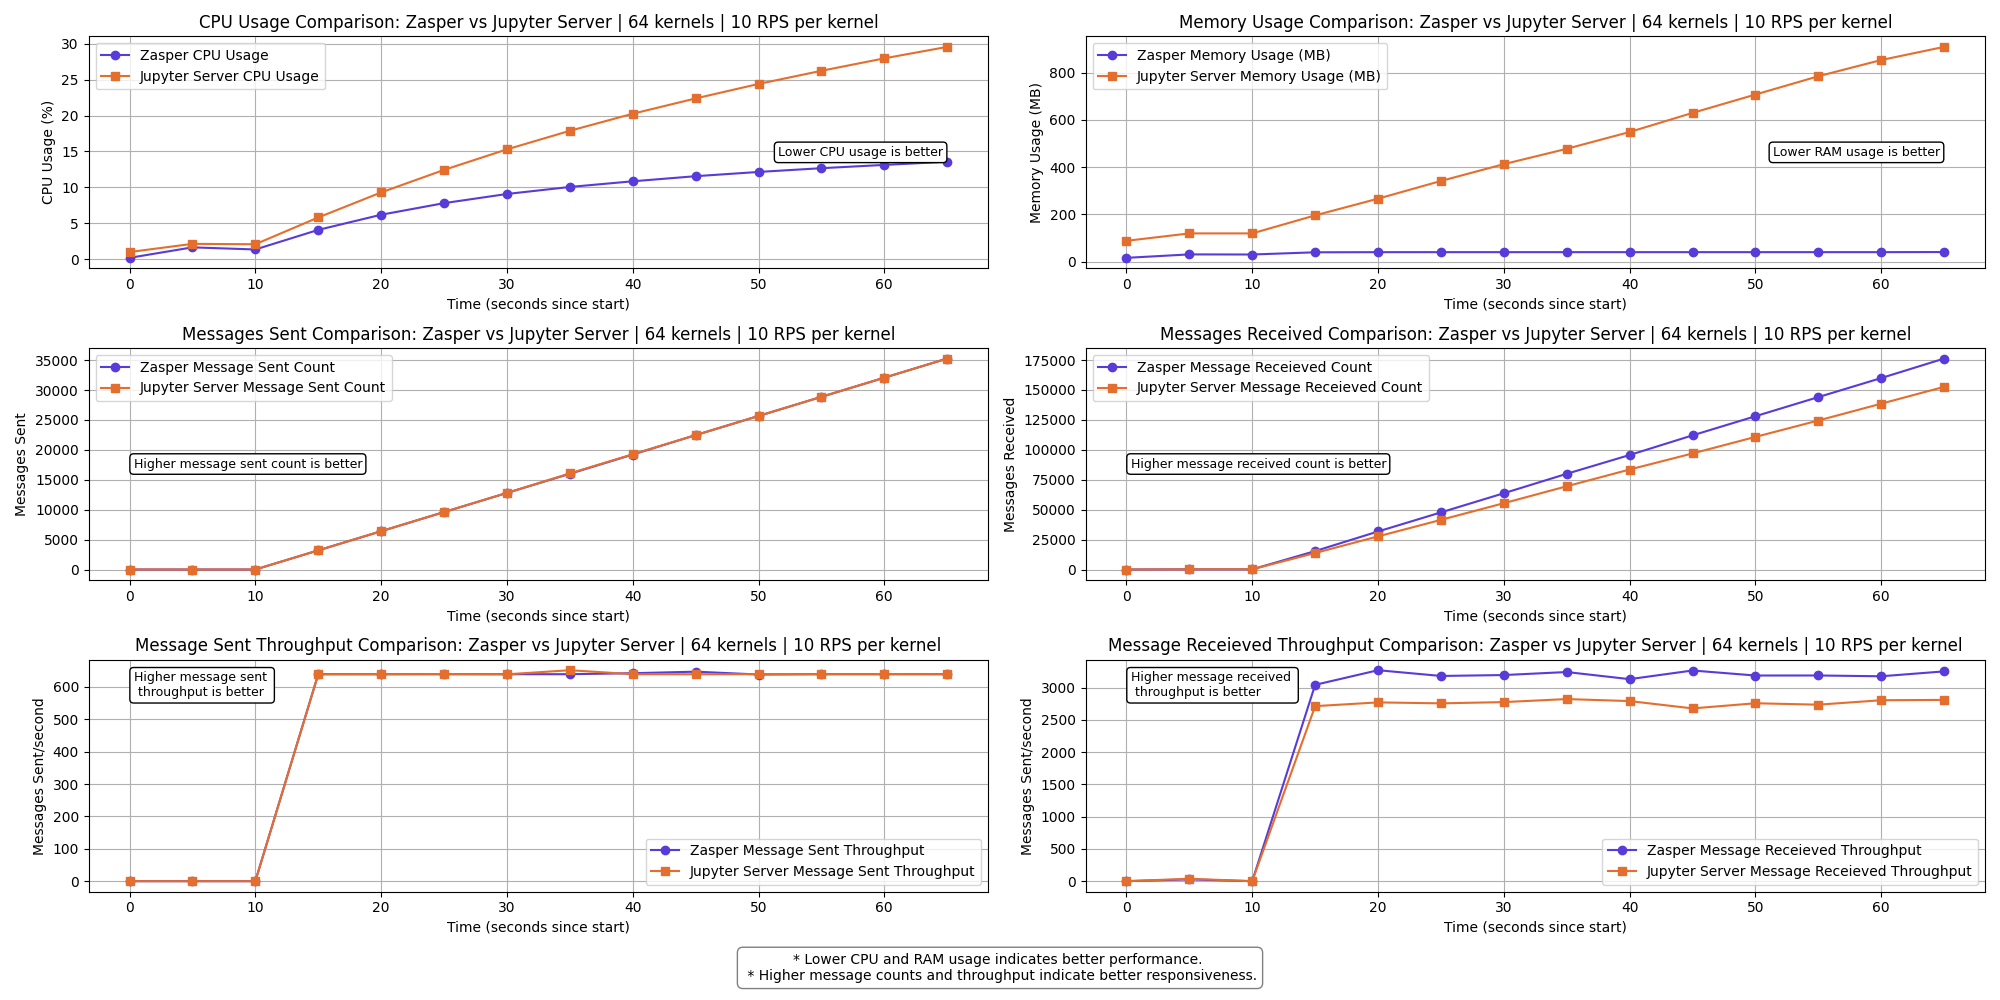
The messages received throughput for Jupyter Server starts to drop here.
A few kernels get disconnect for Jupyter Server.
100 kernels | 10 RPS per kernel
The messages received throughput for Jupyter Server drops to 0.
All Jupyter kernels connections crash at this point.
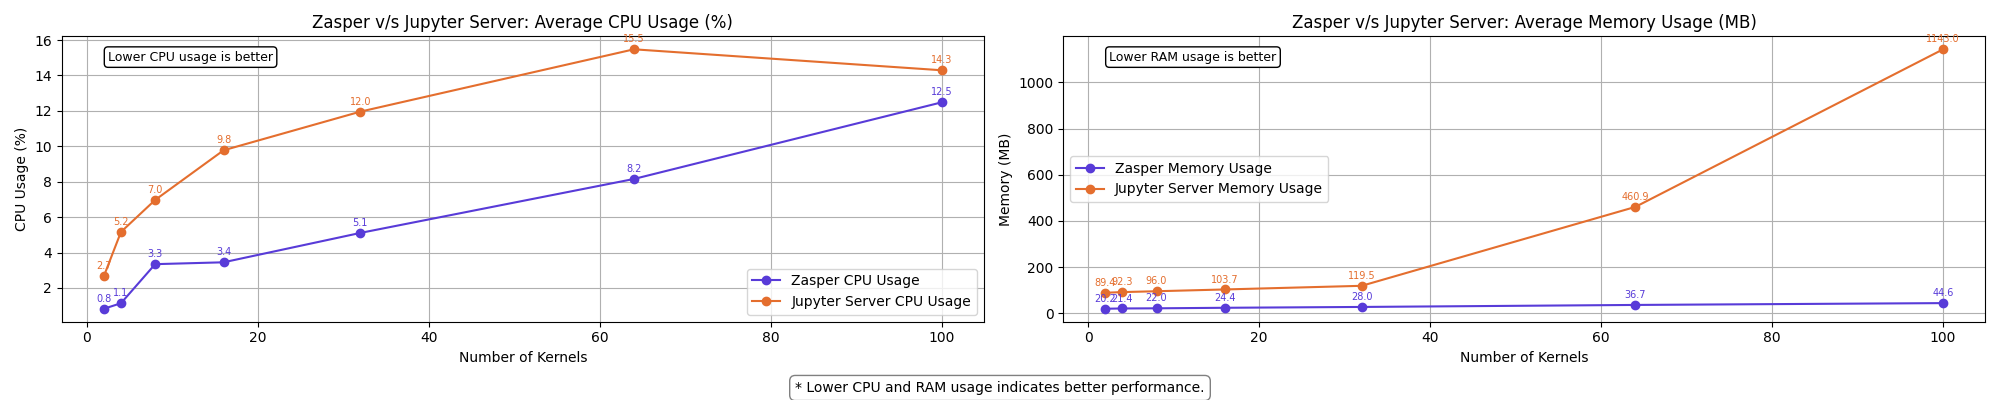
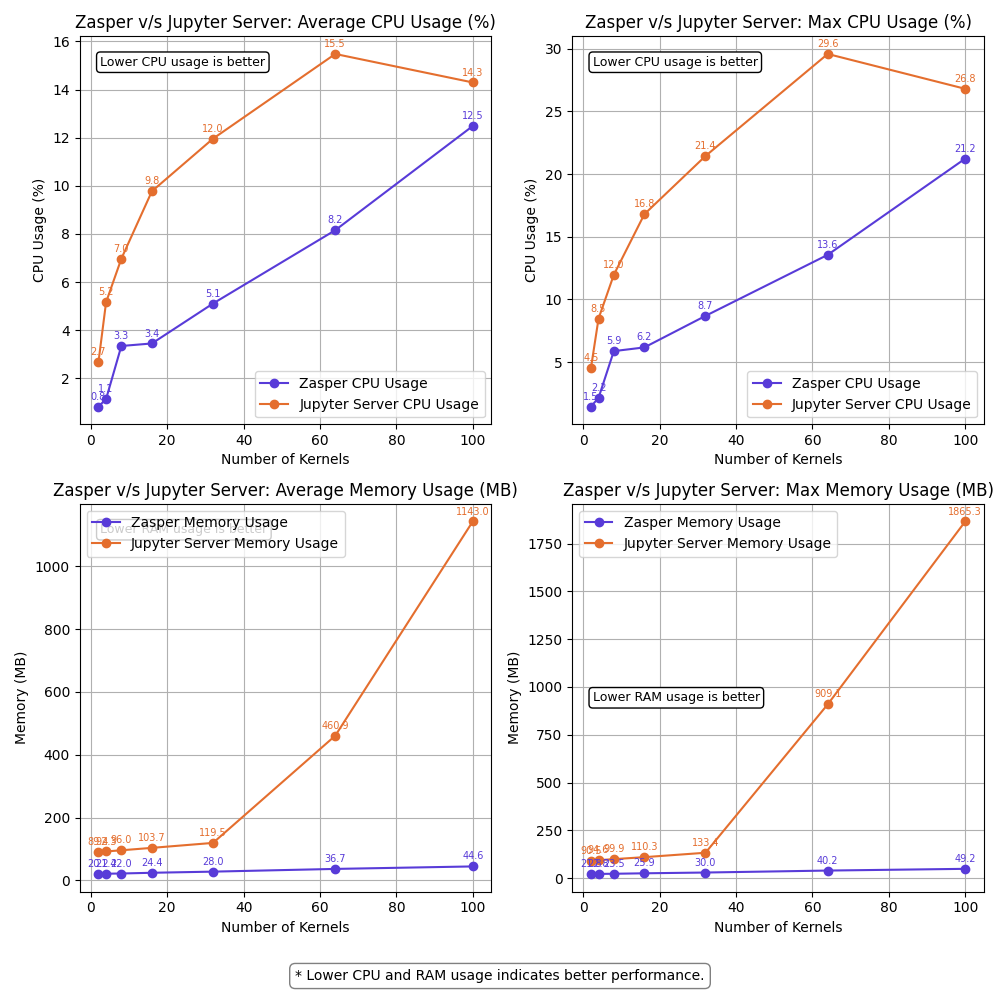
Resource Usage summary | 10 RPS per kernel
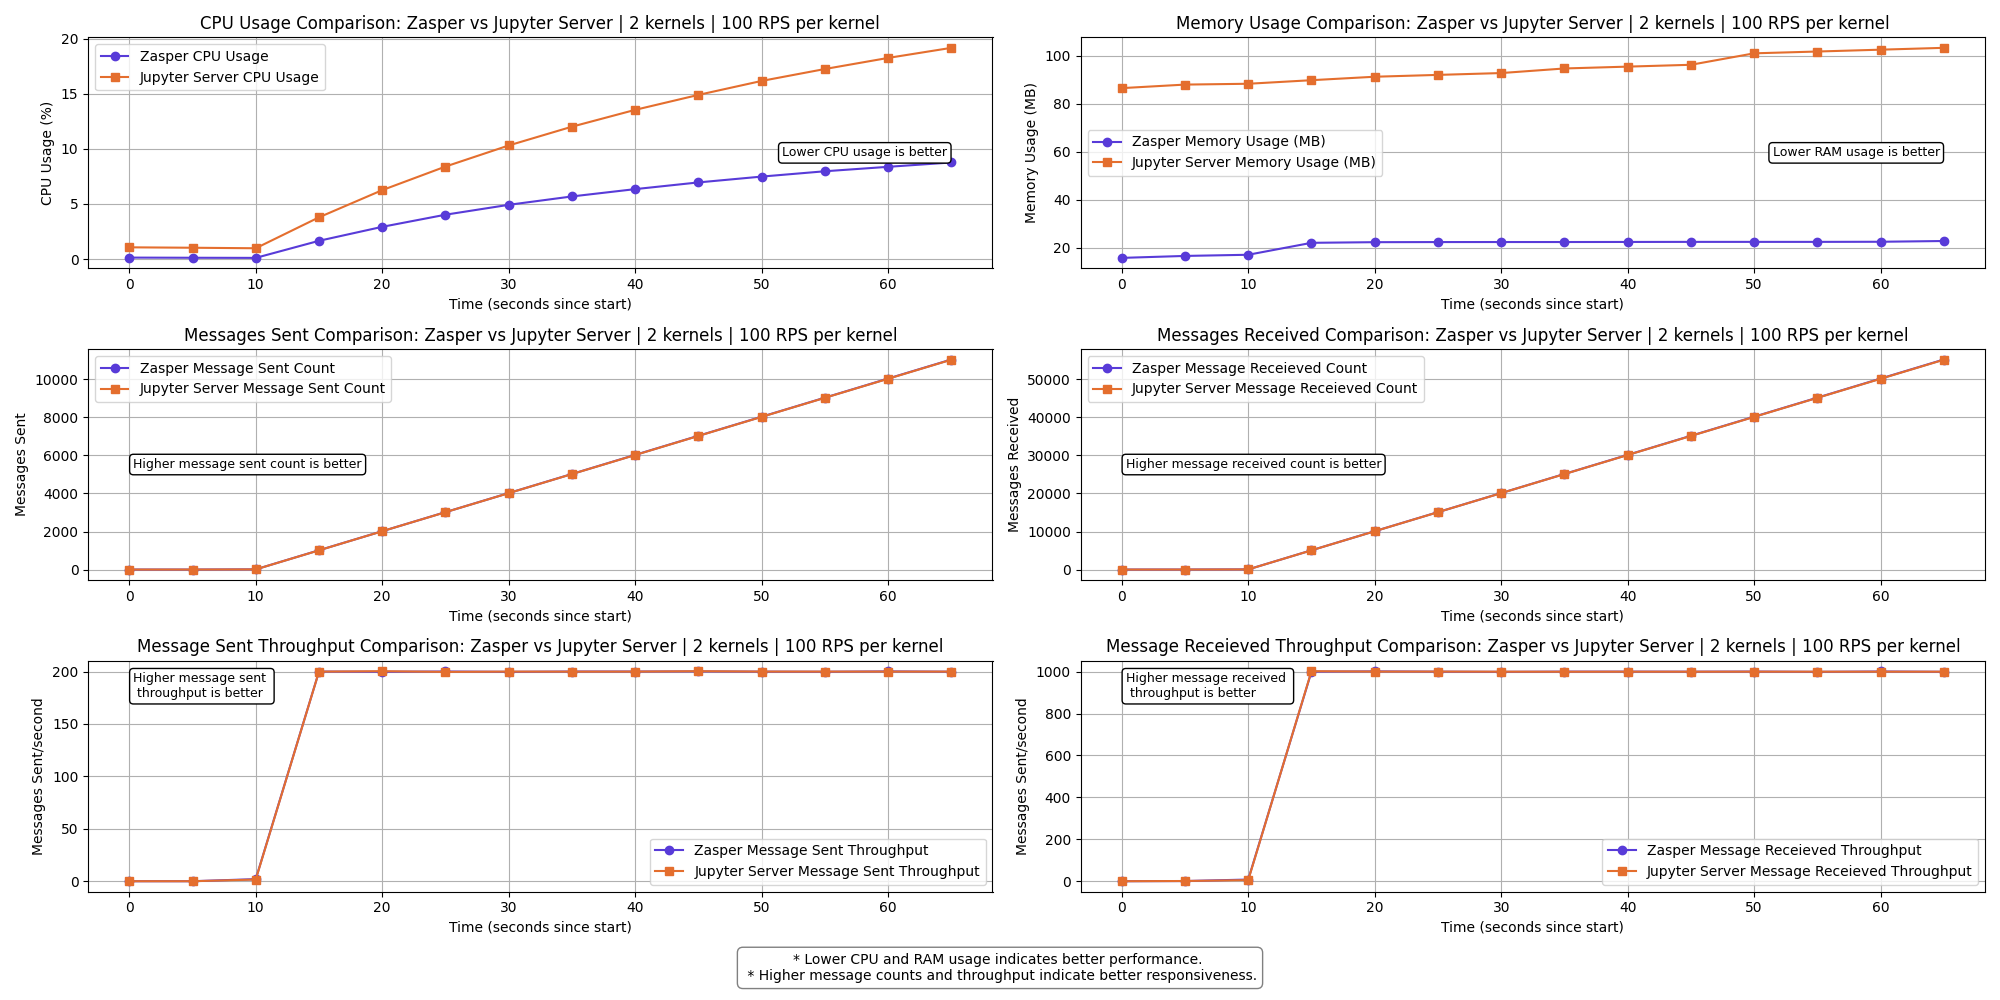
2 kernels | 100 RPS per kernel
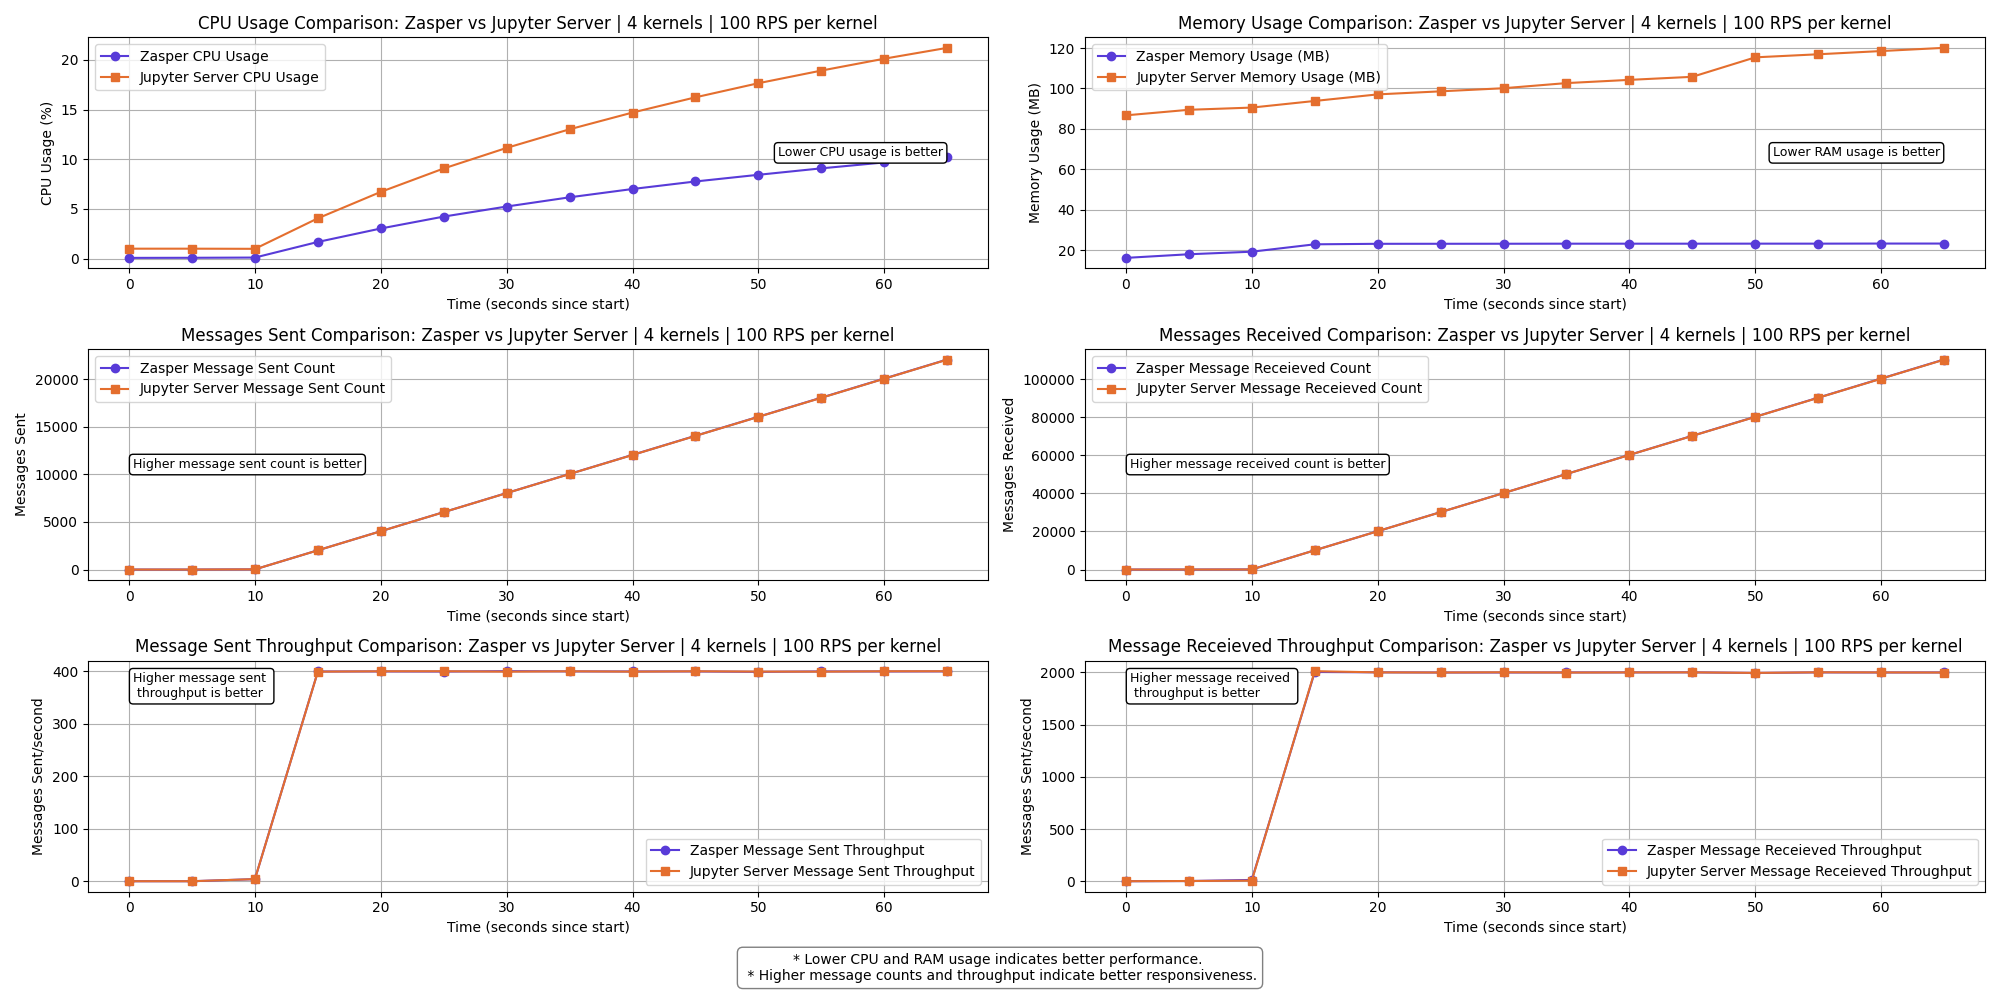
4 kernels | 100 RPS per kernel
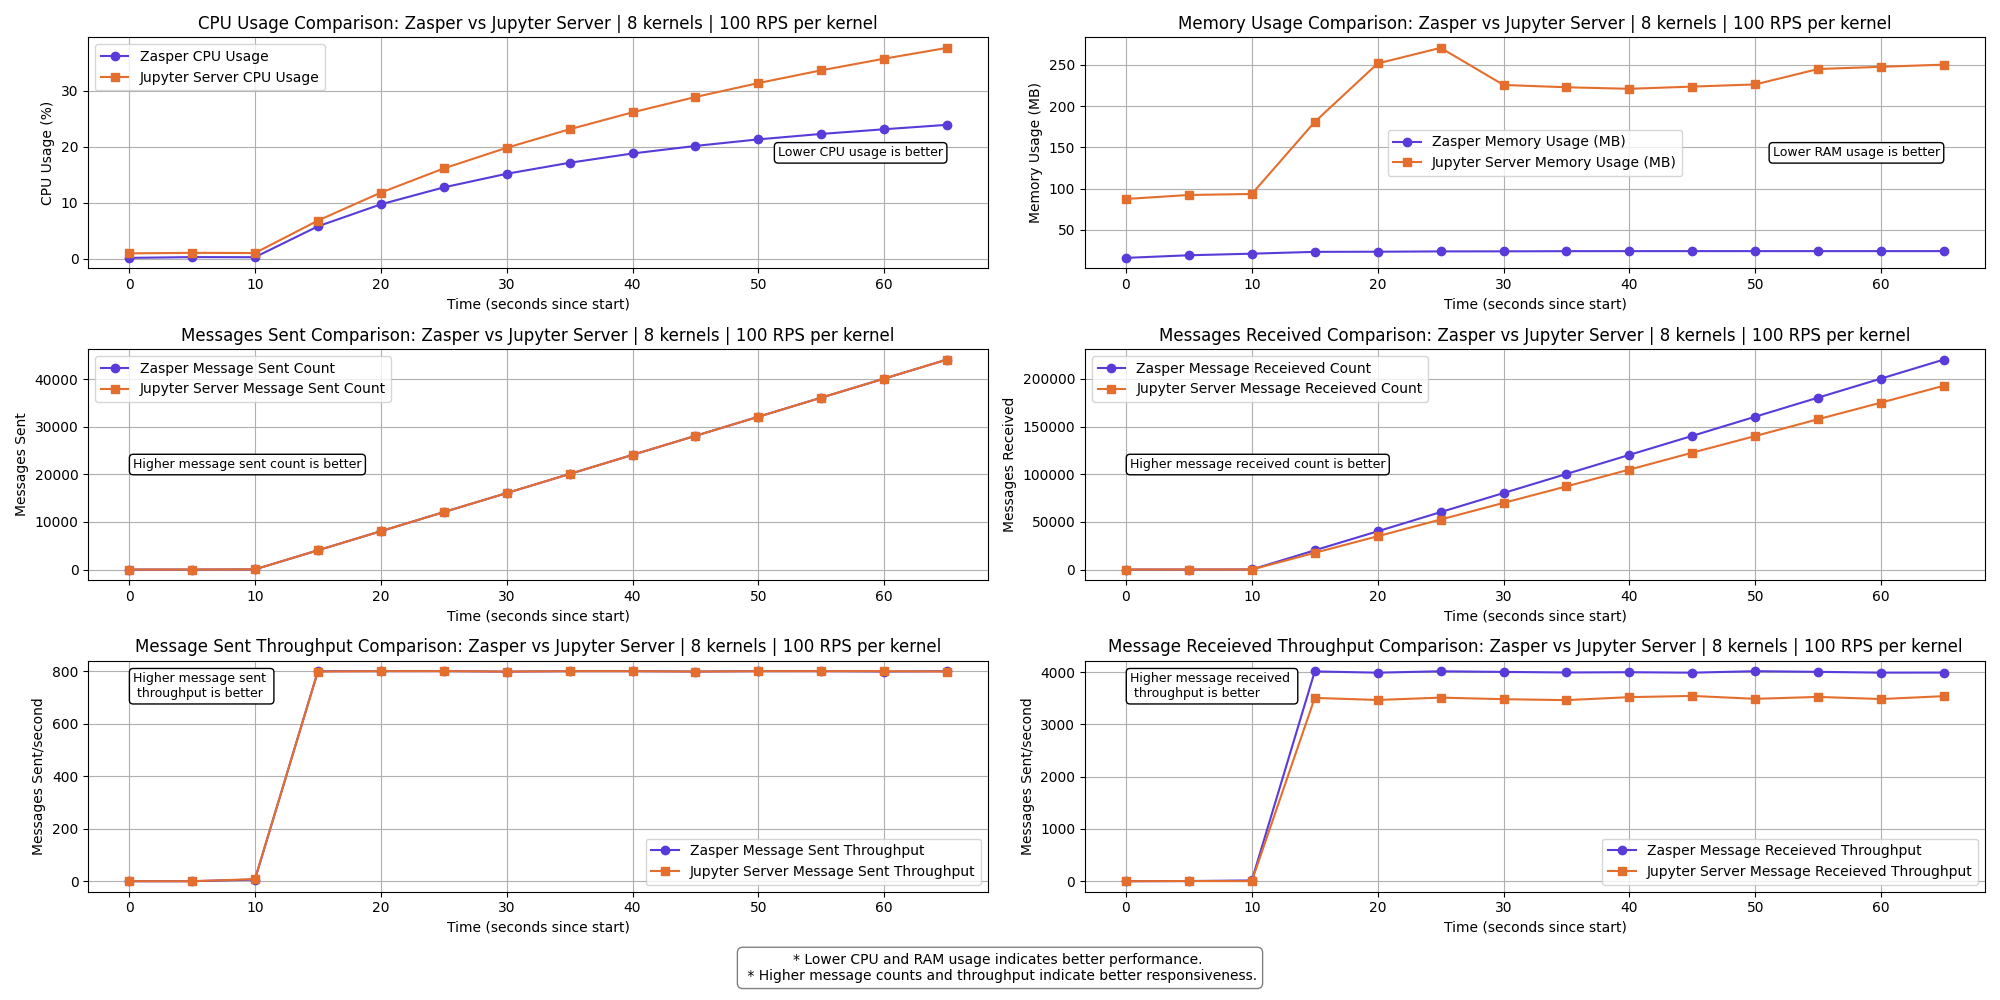
8 kernels | 100 RPS per kernel
16 kernels | 100 RPS per kernel
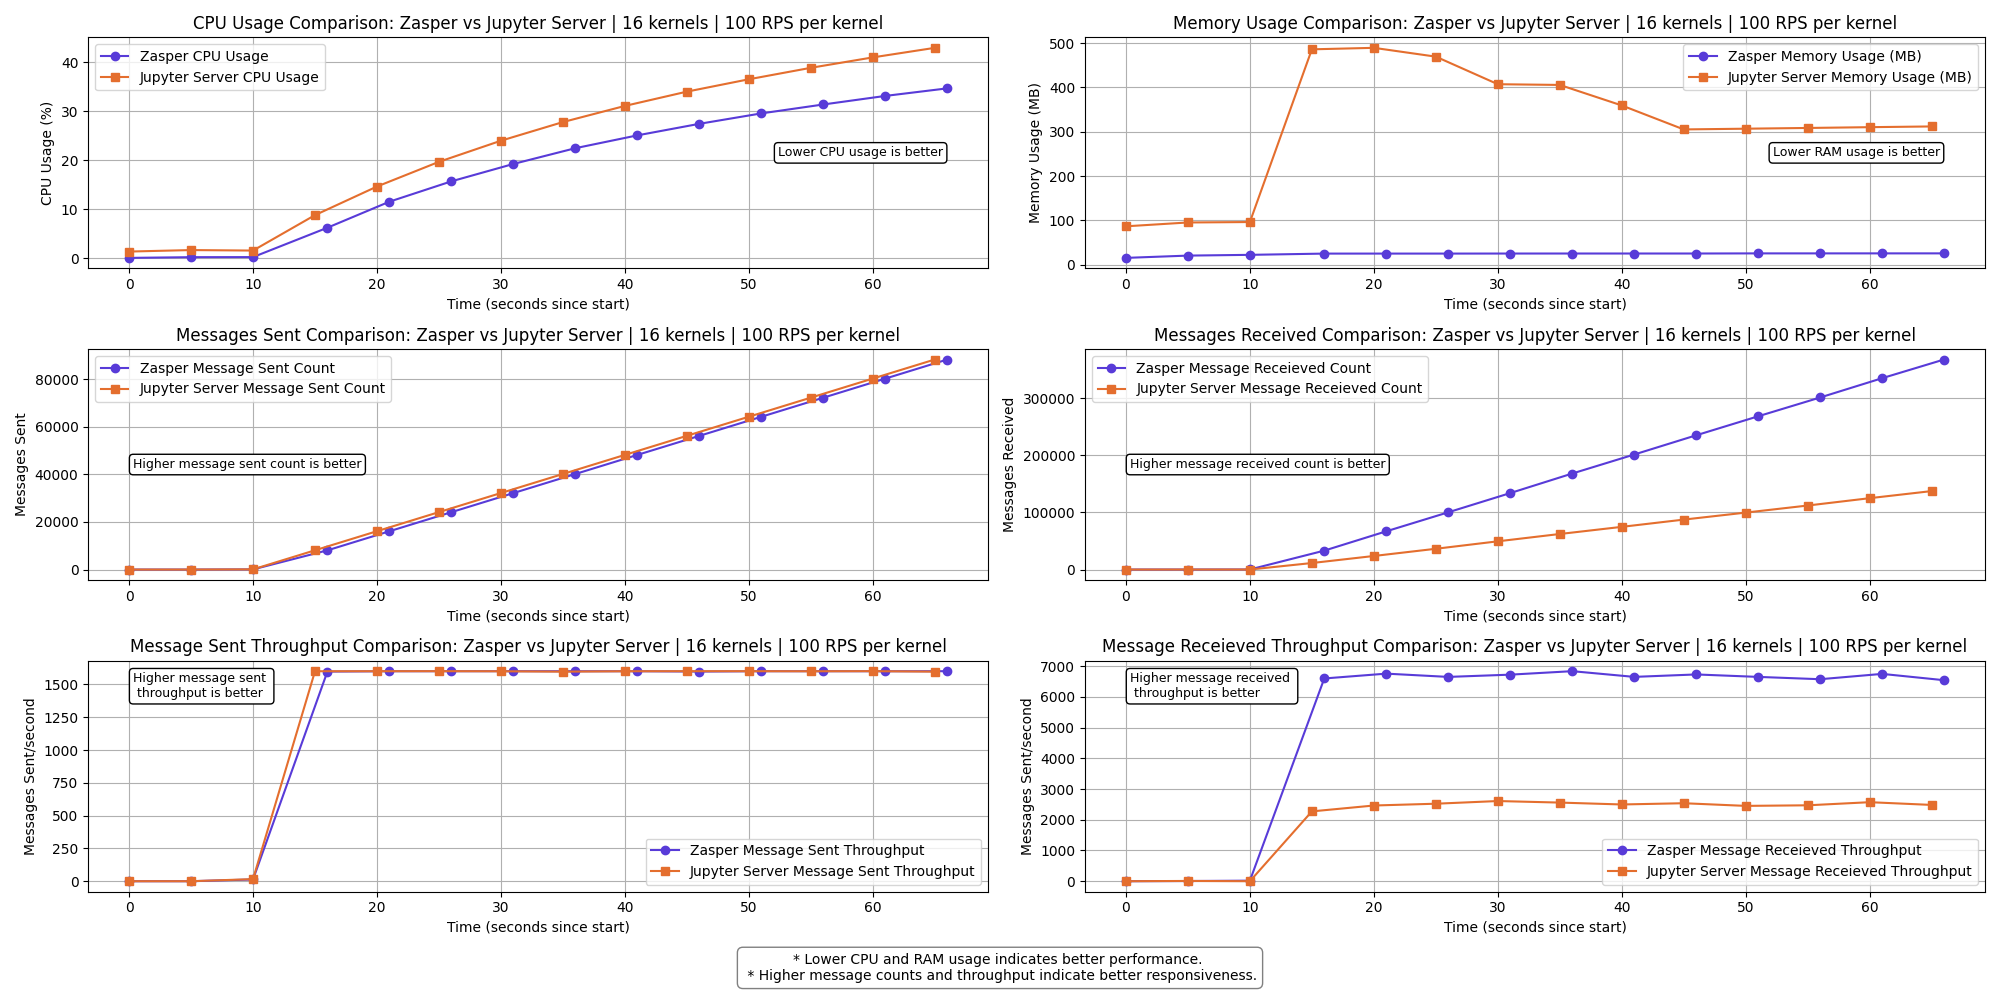
The messages received throughput for Jupyter Server starts to drop here.
A few kernels get disconnect for Jupyter Server.
32 kernels | 100 RPS per kernel
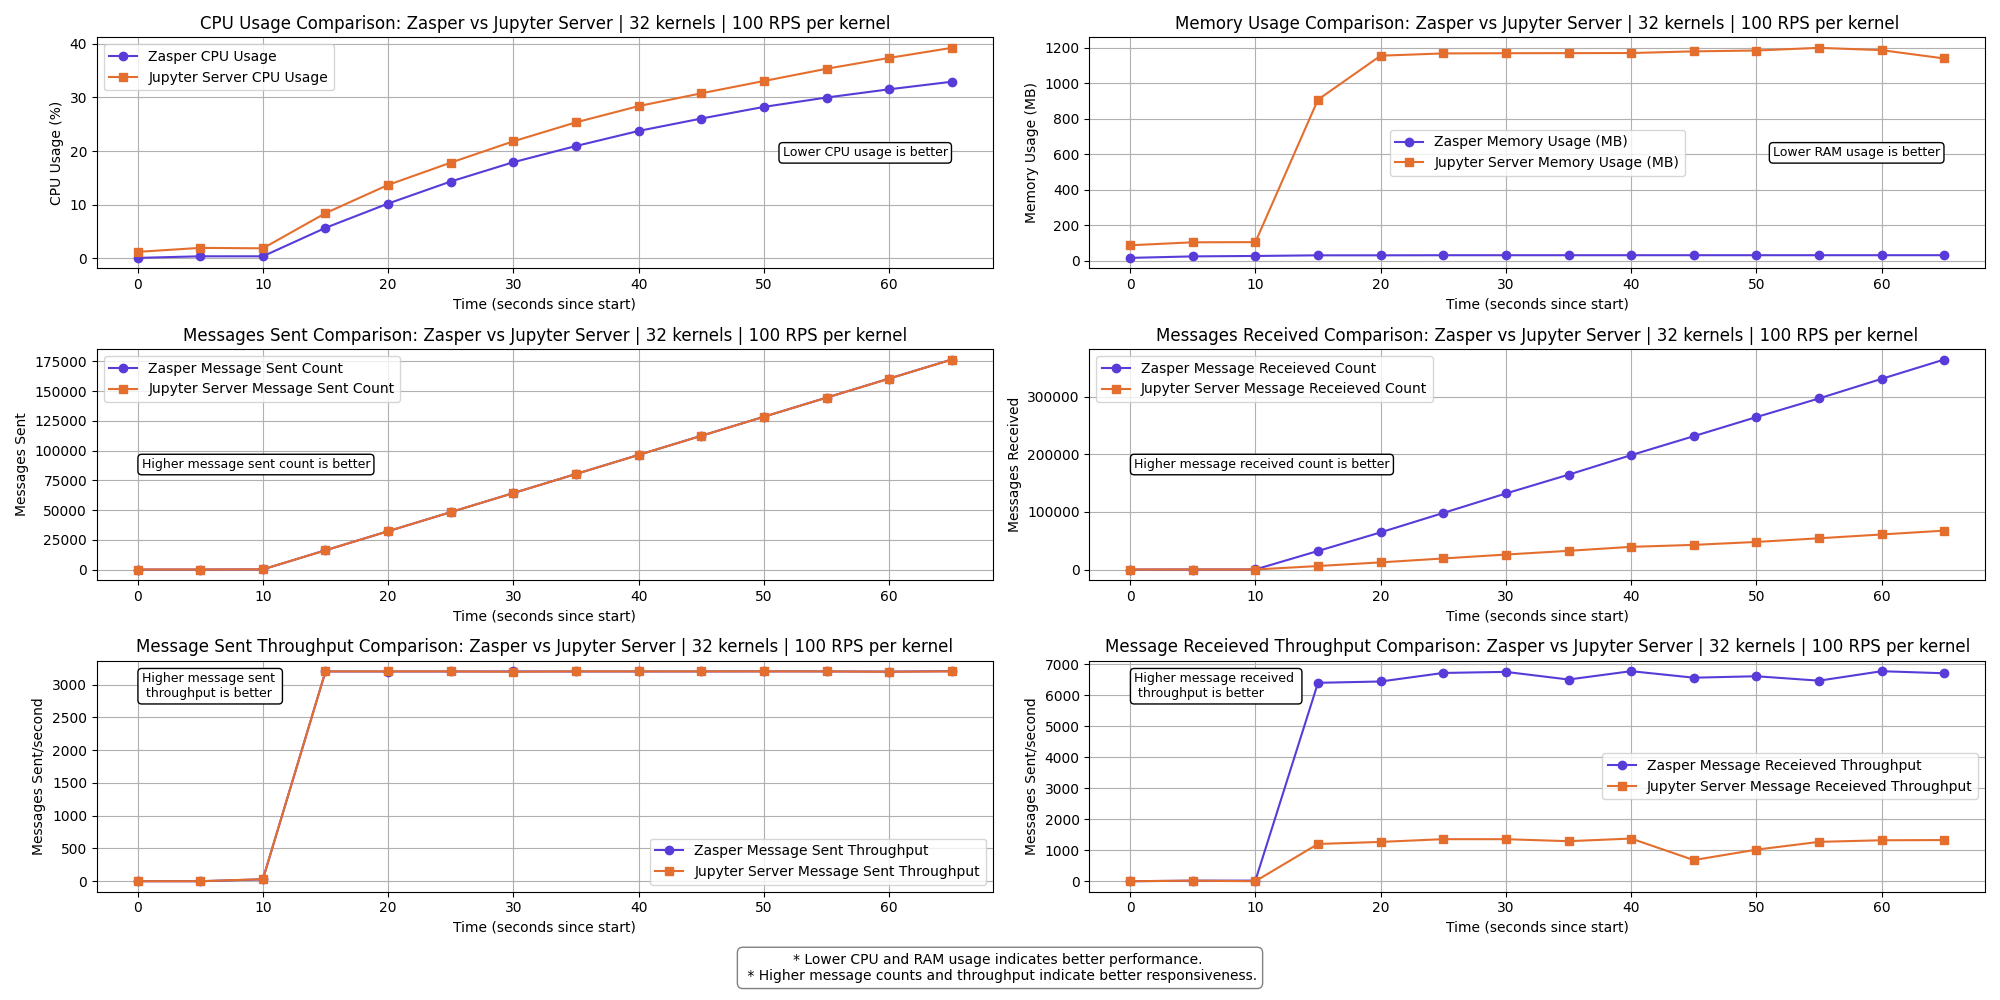
The messages received throughput for Jupyter Server starts to drop even more.
A lot of kernels get disconnect for Jupyter Server.
64 kernels | 100 RPS per kernel
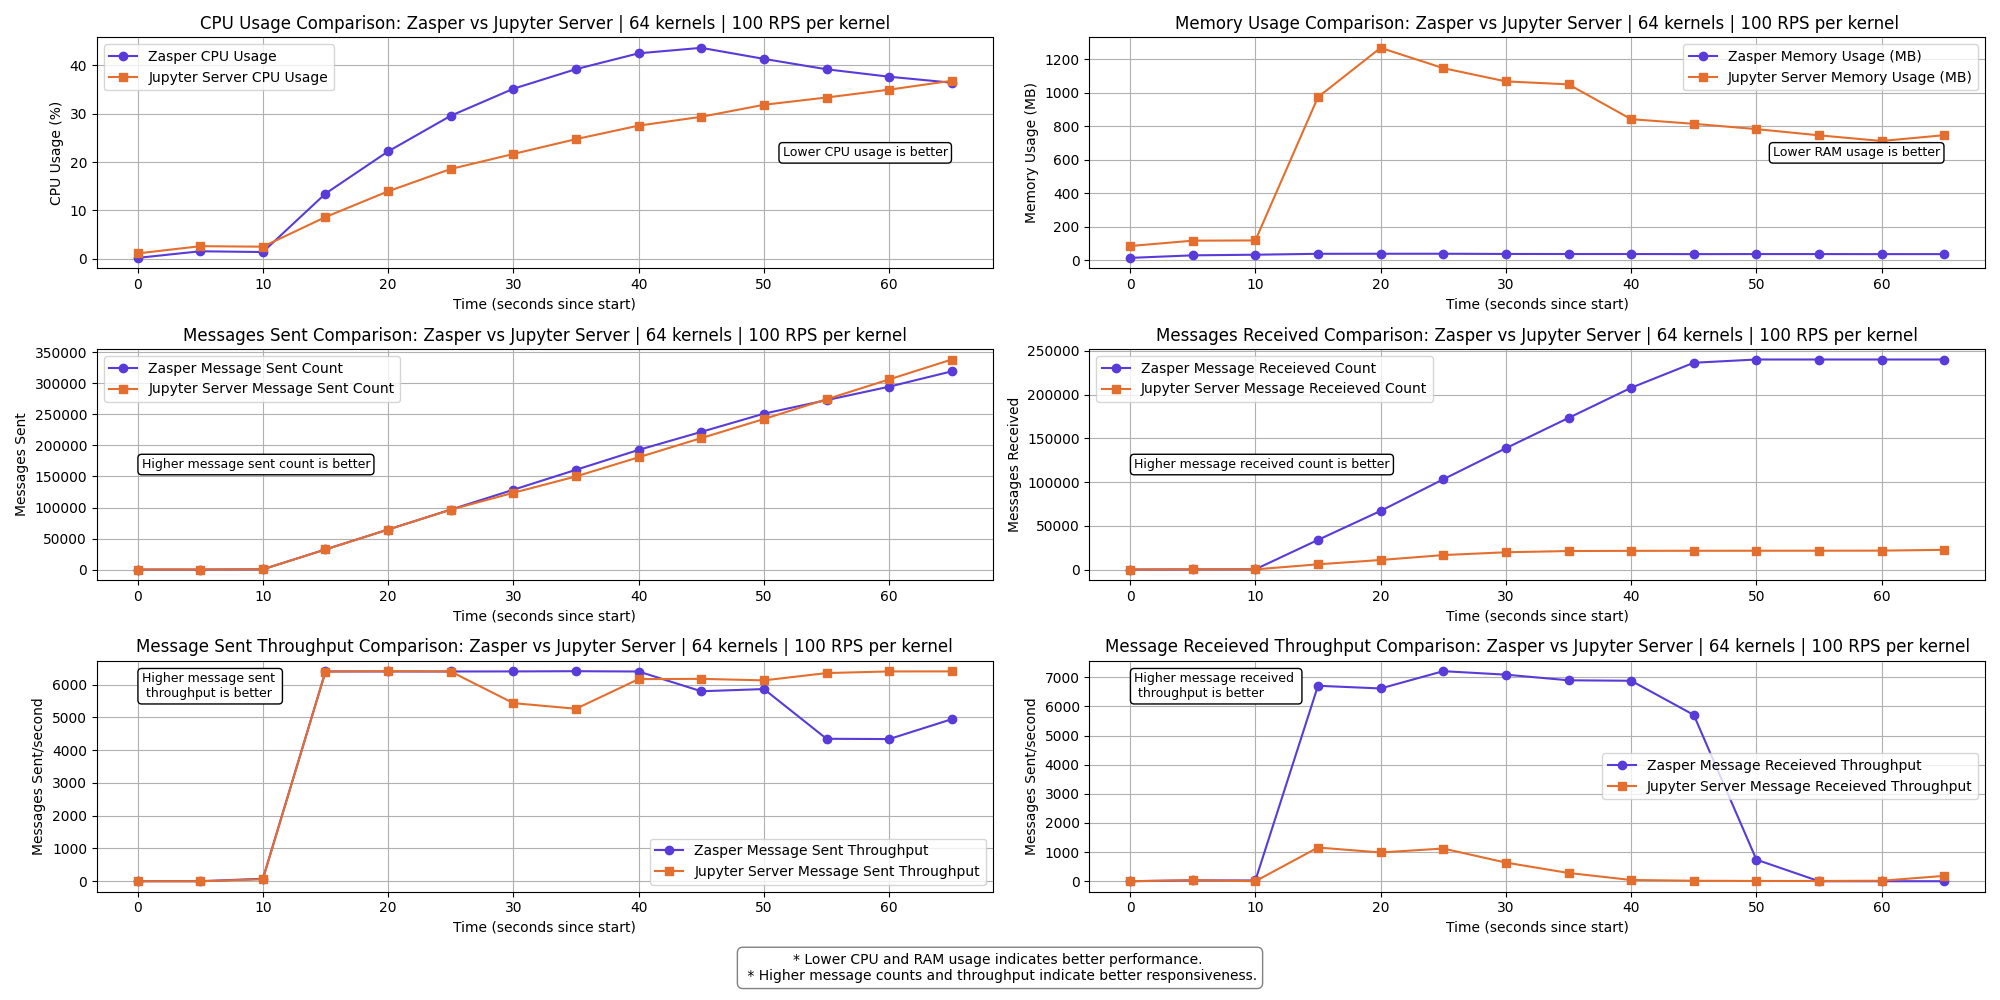
The messages received throughput for both Zasper and Jupyter Server falls to 0.
At this point IPython kernels get overwhelmed and ZeroMQ queues are completely full
Resource Usage summary | 100 RPS per kernel
Observations
- Zasper consumes lesser CPU and lesser Memory in all cases.
- For (64 kernels at 10RPS) and (16kernel at 100RPS), Jupyter server starts losing kernel connections.
- For (100kernels at 10RPS) Jupyter server loose all kernel connections. Message received throughput falls to 0. ZeroMQ message queues get overloaded
- For (64 kernels at 100RPS) both Zasper and Jupyter server loose all kernel connections. At this point, the Jupyter kernels get overwhelmed and ZeroMQ message queues get overloaded.
Explaining the crash
Zasper crash
- Zasper crashed under very high loads compared to Jupyter Server.
- At 32 kernels, 100 RPS per kernel, the through drops but kernel connections are not lost.
- At (64 kernels, 100RPS per kernel), the ZeroMQ message queue fills up as the Jupyter kernel doesn’t consume the messages fast and the queue fills up completely, leading to lost kernel connections.
{"level":"info","time":1745735833,"message":"Error writing message: write tcp [::1]:8048->[::1]:51161: write: no buffer space available"}
{"level":"info","time":1745735834,"message":"Error writing message: write tcp [::1]:8048->[::1]:50991: write: no buffer space available"}
{"level":"error","error":"writev tcp 127.0.0.1:51485->127.0.0.1:5679: writev: no buffer space available","time":1745735834,"message":"failed to send message"}
{"level":"error","error":"writev tcp 127.0.0.1:51136->127.0.0.1:5647: writev: no buffer space available","time":1745735834,"message":"failed to send message"}
{"level":"error","error":"writev tcp 127.0.0.1:51024->127.0.0.1:5230: writev: no buffer space available","time":1745735834,"message":"failed to send message"}
{"level":"error","error":"zmq4: read/write on closed connection","time":1745735834,"message":"failed to send message"}
Jupyter Server Crash
- Jupyter Server tends to crash at lower request throughput due to:
- Message queues filling up faster because execute_reply messages are not consumed quickly enough from the ZeroMQ queues.
- Tornado coroutines running on a single core, combined with Python’s limited scalability, result in websocket connection failures between the client and the server.
- Resource contention between Tornado, ZeroMQ, and the Jupyter kernels, competing for CPU and RAM.
- Garbage collection (GC) further degrading performance under load.
- At 64 kernels, 10RPS per kernel, JupyterLab stops to loose kernel connection and at 100 kernels, 10 RPS per kernel it looses all kernel connections.
[W 2025-04-26 22:48:39.098 ServerApp] Write error on <socket.socket fd=637, family=AddressFamily.AF_INET6, type=SocketKind.SOCK_STREAM, proto=0, laddr=('::1', 8888, 0, 0), raddr=('::1', 57168, 0, 0)>: [Errno 55] No buffer space available
[W 2025-04-26 22:48:39.099 ServerApp] Write error on <socket.socket fd=161, family=AddressFamily.AF_INET6, type=SocketKind.SOCK_STREAM, proto=0, laddr=('::1', 8888, 0, 0), raddr=('::1', 56615, 0, 0)>: [Errno 55] No buffer space available
[W 2025-04-26 22:48:39.099 ServerApp] Write error on <socket.socket fd=198, family=AddressFamily.AF_INET6, type=SocketKind.SOCK_STREAM, proto=0, laddr=('::1', 8888, 0, 0), raddr=('::1', 56658, 0, 0)>: [Errno 55] No buffer space available
Task exception was never retrieved
future: <Task finished name='Task-82495' coro=<WebSocketProtocol13.write_message.<locals>.wrapper() done, defined at /Users/prasunanand/Library/Python/3.9/lib/python/site-packages/tornado/websocket.py:1086> exception=WebSocketClosedError()>
Traceback (most recent call last):
  File "/Users/prasunanand/Library/Python/3.9/lib/python/site-packages/tornado/websocket.py", line 1088, in wrapper
    await fut
tornado.iostream.StreamClosedError: Stream is closed

During handling of the above exception, another exception occurred:
[I 2025-04-26 22:48:39.134 ServerApp] Starting buffering for 3677e004-a553-479c-8cb9-f0da390eee27:1371dd36-816c-4fa0-a63b-fc7429bfd43b
Task exception was never retrieved
future: <Task finished name='Task-82551' coro=<WebSocketProtocol13.write_message.<locals>.wrapper() done, defined at /Users/prasunanand/Library/Python/3.9/lib/python/site-packages/tornado/websocket.py:1086> exception=WebSocketClosedError()>
Traceback (most recent call last):
  File "/Users/prasunanand/Library/Python/3.9/lib/python/site-packages/tornado/websocket.py", line 1088, in wrapper
    await fut
tornado.iostream.StreamClosedError: Stream is closed

During handling of the above exception, another exception occurred:

Traceback (most recent call last):
  File "/Users/prasunanand/Library/Python/3.9/lib/python/site-packages/tornado/websocket.py", line 1090, in wrapper
    raise WebSocketClosedError()
tornado.websocket.WebSocketClosedError
Key observations:
- CPU Usage: Zasper maintained consistently lower CPU usage.
- RAM Usage: Memory consumption was significantly lower for Zasper.
- Throughput: Zasper handled more execution requests per unit of time, indicating better scalability under concurrent workloads.
- Latency: Under extremely high load, the latency drops for both JupyterLab and Zasper. However Zasper has much lower latency compared to Jupyter Server.
- Resilience: Zasper is a lot more resilient compared to Jupyterlab, and can easily recover.
Why Zasper Outperforms Jupyter Server
Go is a compiled language with native support for concurrency and multi-core scalability, whereas Python is an interpreted language that primarily runs on a single core. This fundamental difference gives Zasper, built in Go, a significant performance advantage over Jupyter Server, which is built in Python.
Jupyter Server uses the Tornado web server, which is built around Python’s asyncio framework for handling asynchronous requests. In contrast, Zasper leverages Go’s Gorilla server, which utilizes Go’s lightweight goroutines for concurrency. While both are asynchronous in nature, goroutines are much more efficient and cheaper to schedule compared to Python’s event-loop-based coroutines.
In Jupyter Server, submitting a request to the ZeroMQ channels involves packaging an asynchronous function into the asyncio event loop, along with futures and callbacks. The loop must then schedule and manage these functions—an operation that introduces overhead. Zasper, on the other hand, creates goroutines with minimal scheduling cost, making the process significantly faster.
While Python’s asyncio and Go’s goroutines share similar architectural goals, Go’s model is much closer to the hardware. It schedules coroutines across multiple CPU threads seamlessly, while Python is limited by the Global Interpreter Lock (GIL), preventing true multi-core parallelism.
When request handling slows down in Jupyter Server, memory usage climbs, CPU gets overwhelmed, and the garbage collector (GC) starts to intervene—often resulting in degraded performance. Under high loads and constrained resource, the situation gets even worse as Jupyter Server, ZeroMQ and Jupyter Kernel all compete for resources, leading to Jupyter Server’s websocket connections getting lost.
Zasper also crashes but under extremely high loads when ZeroMQ kernels fill up as Jupyter kernels get overwhelmed. Zasper has much higher resiliency.
Zasper is designed around the principle of “Use More to Save More.” As request volume increases, Zasper’s efficiency becomes more apparent. Its architecture thrives under load, delivering better throughput and stability at scale.
Benefits of Zasper
For Individual Users
- Improved Responsiveness: Faster execution of notebook cells.
- Lightweight: Reduced memory usage allows smoother multitasking, especially on lower-spec machines.
For Enterprises
- Cost Efficiency: Lower resource usage translates to fewer cloud compute instances required.
- Better Scalability: Efficient resource handling allows support for more users and sessions per node.
Conclusion
This benchmarking study highlights Zasper’s performance advantages over the traditional Jupyter Server. Whether for individual developers or large-scale enterprise deployments, Zasper demonstrates meaningful improvements in resource efficiency and execution throughput, making it a promising alternative for interactive computing environments.
🙏 Thanks to Jupyter Community
Zasper would not exist without the incredible work of the Jupyter community. Zasper uses the Jupyter wire protocol and draws inspiration from its architecture. Deep thanks to all Jupyter contributors for laying the groundwork. Data Science Notebooks would not have existed without them.
🤞 Support Zasper
If you like Zasper and want to support me in my mission, please consider sponsoring me on GitHub.
Discussions
Please feel free to mail me at prasun@zasper.io to report any corrections or irregularities.
Copyright
Prasun Anand
©2024-2025 Prasun Anand | All rights reserved.